Black arrow left icon
Back to Portfolio
Vital Strategies: Impact Map
Connecting global public health work to the places and people it reaches.
Client:
Vital Strategies
Role:
Product Designer
Team:
Art Director and Engineering
Tools:
Figma and Lovable
Year:
2026
Hero Grid
Project Overview
Background
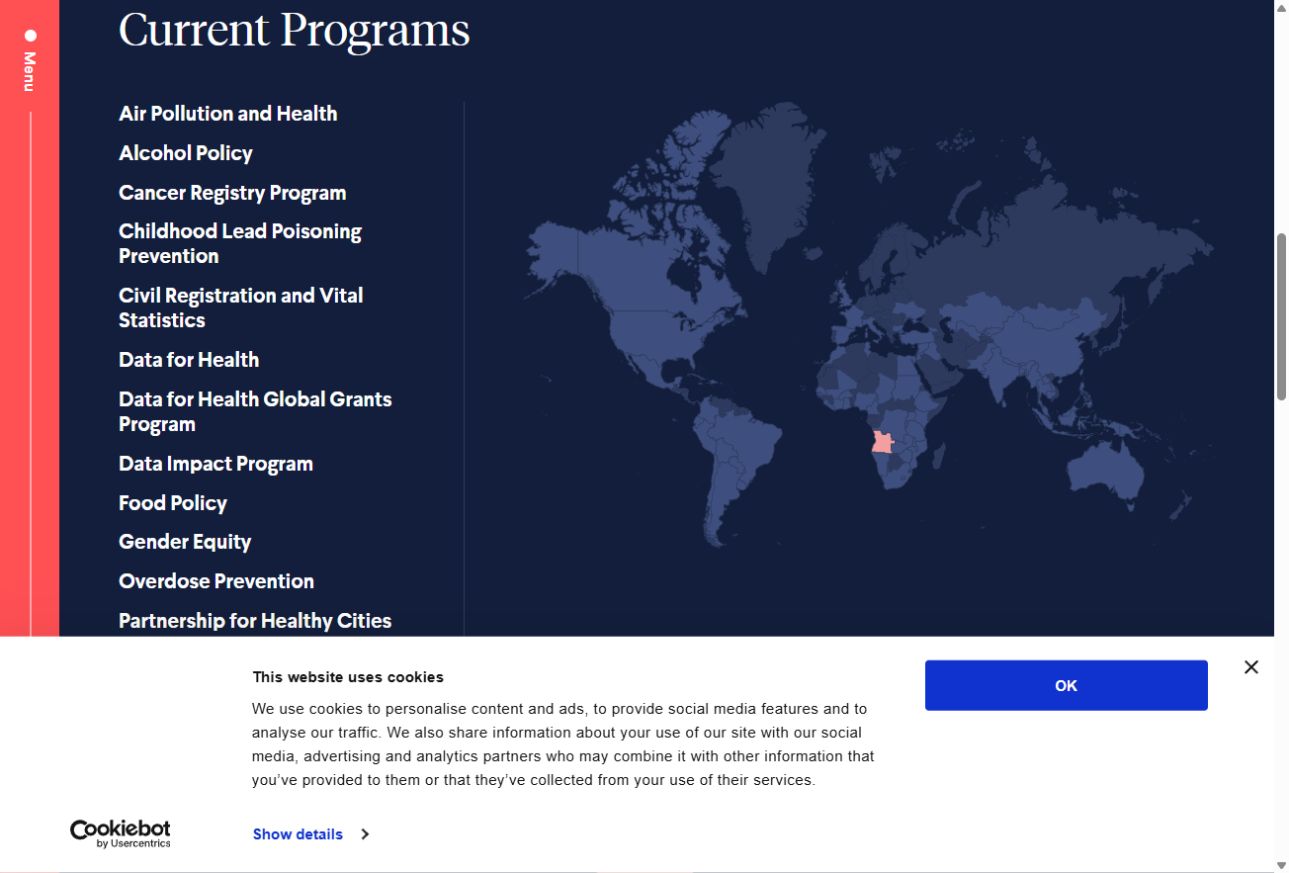
Vital Strategies’ public health work spans countries, cities, and programs. For funders and government partners, understanding that reach starts with two related questions: where does Vital work, and what does it do there? The earlier program map focused on geographic reach. Visitors had to leave the map to learn more about the work behind those areas.

The information itself was also complex. A place could connect to several programs, while a program could span multiple locations. As part of Vital’s website redesign, the interactive map needed to make those relationships understandable, with a clear way to move from a global overview into more detailed information.
My responsibility
I was responsible for the map’s UX and visual design, from user flows and wireframes through UI and interaction specifications. My central design challenge was making interconnected, nested information intuitive to explore: helping visitors understand how places and programs relate, what sits within each level, and where they could go next.

Within the visual direction of Vital’s wider website redesign, I shaped the information hierarchy and navigation to help visitors move naturally between the overview and related details. Close collaboration with engineering brought that structure into the map’s interactions, including filtering and transitions that preserved context as visitors explored.
Goals + Opportunities

Make relationships clear

1

Help visitors understand how countries, cities, and public health programs connect.

Reveal detail at the right moment

2

Give each level a clear hierarchy, with enough context to understand it and a natural path to related information.

Support different ways to explore

3

Let visitors begin with a place or health topic and follow its connections across the main map, program pages, and mobile layouts.

Before: showing where, but not the whole story
Vital’s earlier map could show where a program worked. What it couldn’t easily convey was the bigger picture: what was happening in those places, how the programs connected, and why that work mattered. These were questions the team regularly encountered in conversations with potential funders and partners. They wanted the website to help answer them, giving visitors a clearer introduction to Vital’s work alongside its articles and thought leadership.

Behind the scenes, teams were also creating separate maps for reports and presentations. Bringing several programs into one view wasn’t straightforward; overlapping colors and patterns could make their shared presence harder to understand. For me, the design challenge was to bring those connections into focus—so someone arriving with a place or health issue in mind could follow that interest and understand the work around it.
Design Process
Start with the questions behind the map

The team’s requirements and workshop notes brought two needs into focus:

  • Funders and government partners wanted to understand Vital’s work in a place or health topic, and
  • Internal communications and development teams needed a clear way to support those conversations.

I explored flows that began with a location, a program, or the map itself. The wireframes helped me decide what belonged in the global overview, what should appear within a selected place or topic, and how visitors could follow a related item without losing the context of their starting point.
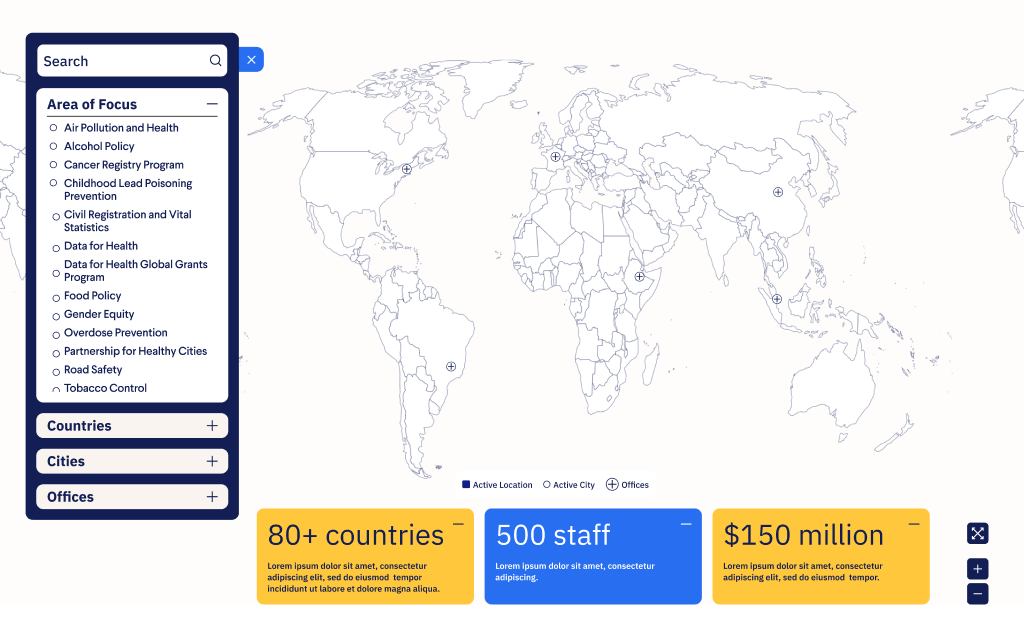
Early wireframe showing map filters, map navigation, and an impact summary alongside sample content.

Wireframes explored how filters, map navigation, and impact summaries could share one view. Sample content illustrates the layout.
Test how the connections behave
The information hierarchy needed to hold together as visitors changed their selections. I used AI-assisted prototyping in Lovable, supplying design references and a spreadsheet of Vital’s program locations to explore relationships and interaction states that were difficult to judge in static screens.

I reviewed the data relationships and requested changes to active and hover states, selected-filter chips, location counts, and reset controls. The working prototype gave us a concrete way to discuss how visitors would keep track of their choices before engineering built and revised those behaviors.

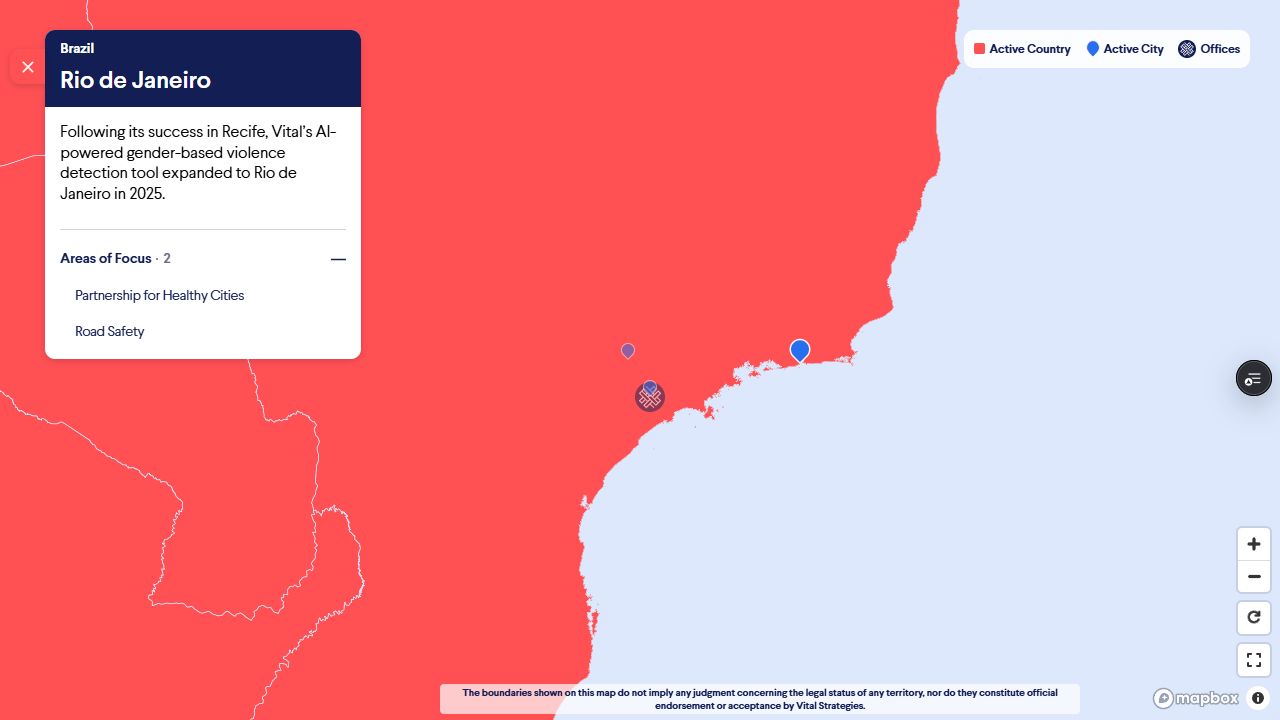
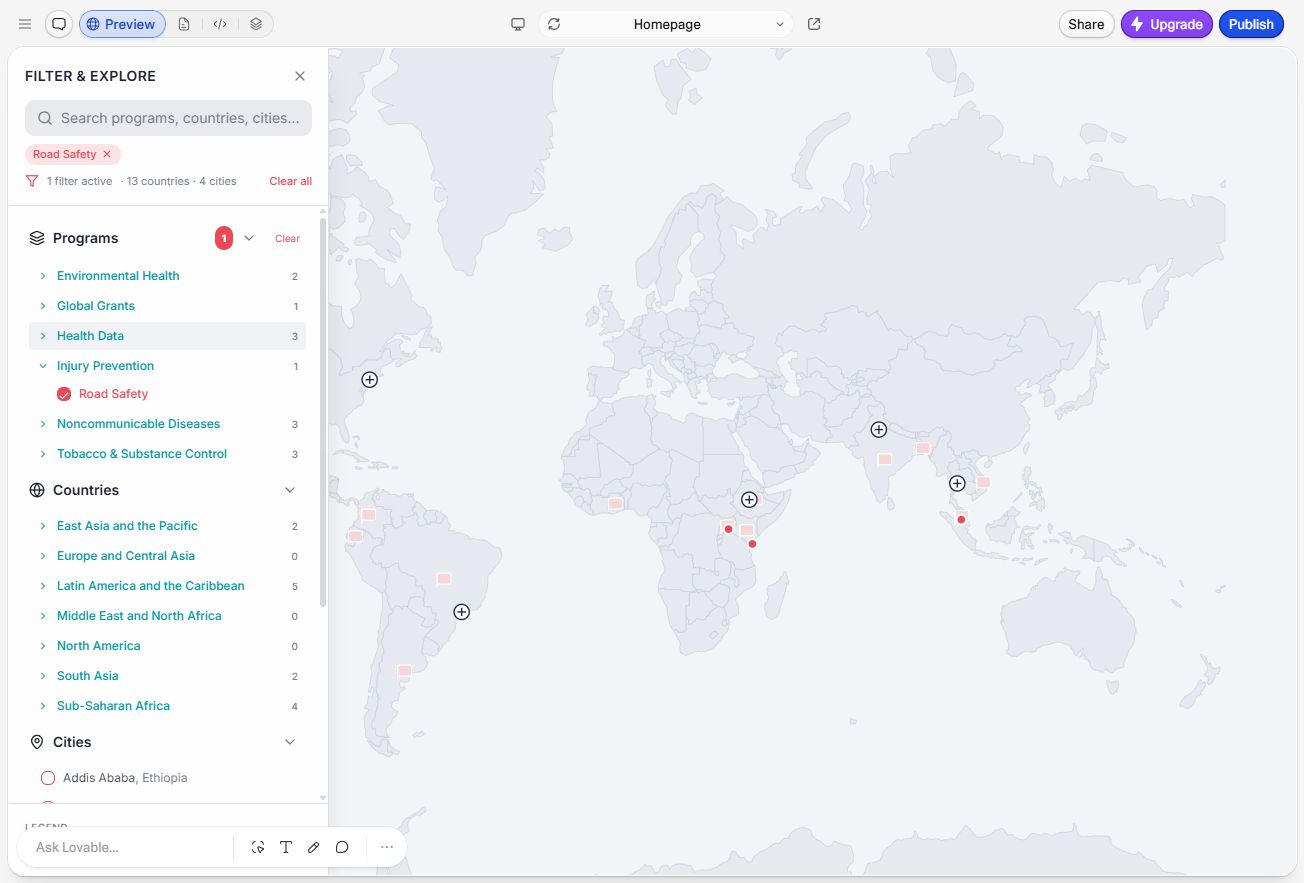
Filtering supported that exploration. With engineering, I worked through how selections should combine: programs selected within a category combine their results, while a location selection narrows those results. In the live map, Road Safety and Partnership for Healthy Cities can be combined with Brazil to show their related Brazilian cities. Choosing the program or location first leads to the same result.
Lovable map prototype with Road Safety selected, related country and city counts, and removable filter chips.

The Lovable prototype made filter relationships, selected chips, and changing location counts testable.
Give each level a clear place
The central UX question was how much information to show at each level and how to make the next connection feel natural. A global map needed to communicate Vital’s reach; a selected place needed a concise introduction and a clear route to its related programs. Showing all of that at once would compete with the map itself.

Feedback led me to bring the controls, map, and information card into a more compact relationship. I organized the cards around an introduction, related programs or locations, and optional impact content, revealing detail as visitors explored.

Selected-marker states and back navigation helped preserve context. I also distinguished actions that explored the map from links that opened another page. On mobile, expanded filters had their own focused panel so the hierarchy remained manageable on a smaller screen.
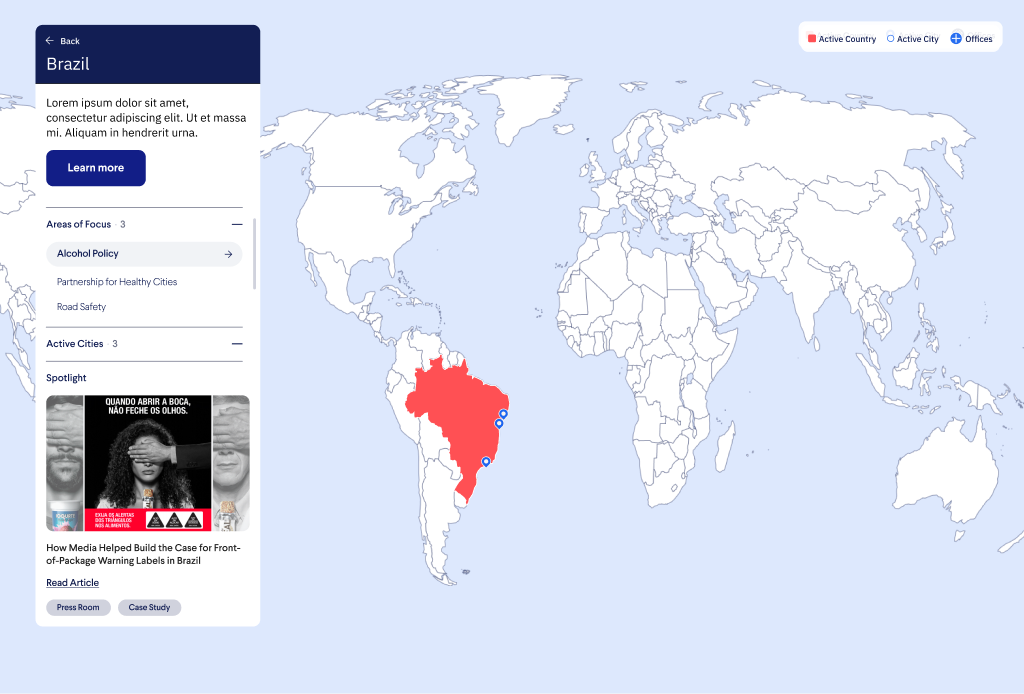
Figma country-detail design for Brazil showing related programs and a featured story; some text is placeholder content.

A country-detail design connects Brazil to related programs and a featured story. Some text is placeholder content.

Outcome
An explorable view of Vital’s work
On the earlier site, someone looking at a program could see where it worked, but had little room to explore what connected those places and programs. I wanted the new map to give visitors a way to follow that curiosity.

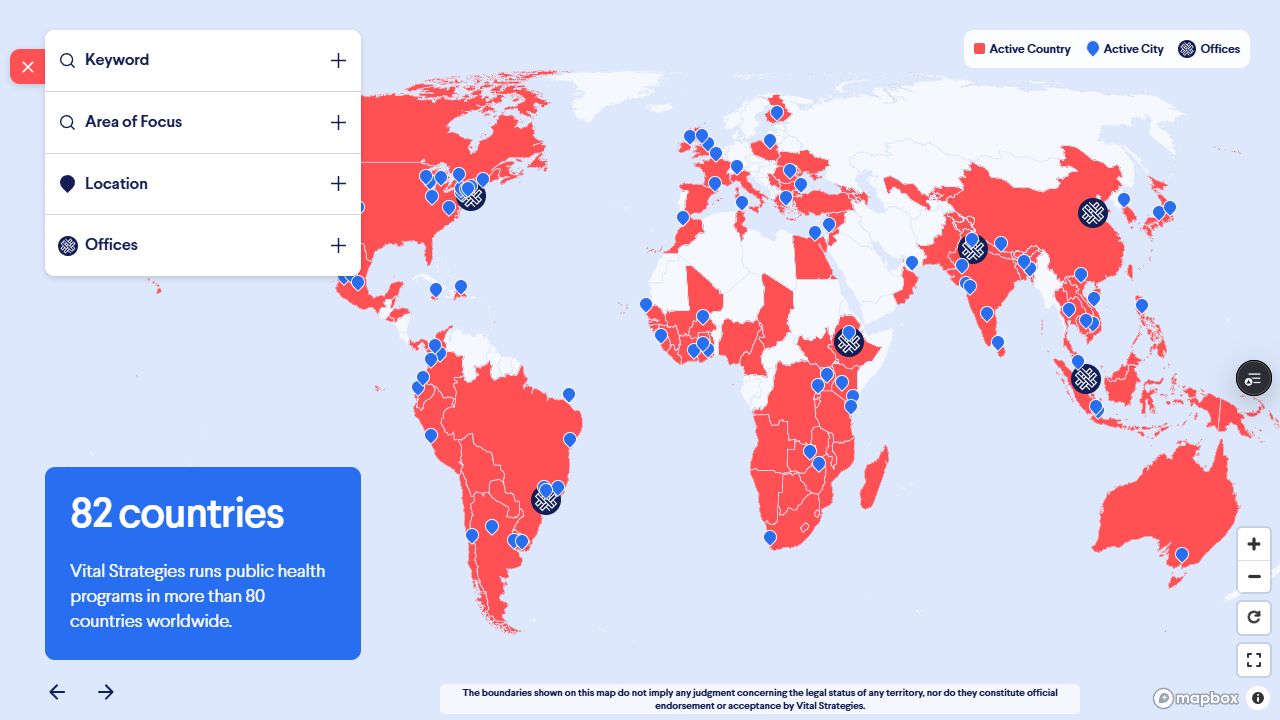
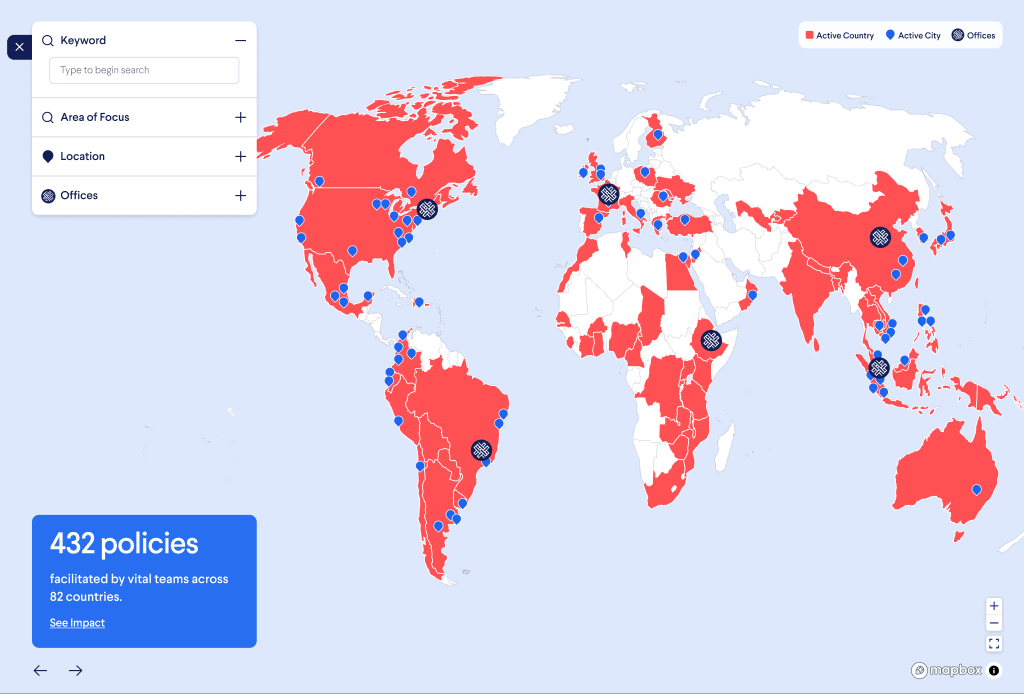
A visitor can now start with a country, city, or health topic and move into related information within the map. Someone interested in Brazil, for example, can narrow the view to relevant programs, select a city, and see a short description alongside its areas of focus. Each step gives them a more specific picture of Vital’s work while keeping their starting point in view.

For funders and government partners, this makes it possible to explore the work around a place or issue they care about. For Vital’s communications and development teams, the map provides a shared way to show how that work connects.
What this project sharpened
Making complex information approachable
My biggest UX challenge was helping visitors make sense of information that didn’t fit neatly into one hierarchy. A country could connect to several programs, while each program could span many places. Working through those relationships sharpened my judgment about what to show first, when to introduce more detail, and how to help someone explore without losing their place.

Using AI to test the experience earlier
Building a working prototype with Lovable gave me a way to stress-test interactions that were difficult to evaluate in Figma alone. I could try different combinations of filters, follow connections across the map, and spot behaviors that needed another pass. That made conversations with engineering more concrete and saved our engineer from having to build each exploration just so we could test an idea. For me, the value was having more room to question and refine the experience before committing development time.