Black arrow left icon
Back to Portfolio
Open Rent Initiative: Compare Segments
Helping housing staff compare rental segments without rebuilding the analysis in spreadsheets.
Client:
Mountain View Housing Department
Role:
Product Designer
Team:
Project Manager and Engineering
Scope:
Compare Segments UX/UI
Year:
2026
Project Overview
Background
For Mountain View’s housing staff, answering a rental-market question often meant working across several sources: market listings, a rent-stabilization registry, and separate affordable-housing records. Each held part of the picture. Staff had to download spreadsheets, line up categories, and assemble charts before they could share an answer.

Open Rent brought these records into a shared platform. The next challenge was making that data useful for a question such as: how do rents in stabilized housing compare with rents in otherwise similar, unrestricted housing?
My responsibility
I owned the UX/UI design of Compare Segments. My work focused on how staff defined two rental groups, understood the differences between them, and returned to a comparison without repeating the setup.

I collaborated with the lead product designer, engineering, and product managers to map how staff would enter and use the tool. The rental-stock overview provided the context for my feature; the comparison workflow was my area of ownership.
Goals + Opportunities

Compare in place

1

Let staff compare groups within the same tool they use to explore rental data.

Identify both segments

2

Keep both groups clearly identified so staff can follow what they’re comparing.

Read the differences

3

Put the groups side by side so staff can see where they differ and make sense of the results.
Design Process
Start with the question staff needed to answer
The team’s discovery and current-state workshops helped ground the work in the questions staff needed to answer. They wanted to compare housing groups by characteristics such as bedroom count and program type, then explain what they found to colleagues and decision makers.

One distinction kept coming up: asking rent tells us what someone entering the market would pay, while in-place rent tells us what an existing tenant pays. I wanted that difference to stay clear throughout the experience, from choosing filters to reading the results.
Keep the release focused on two segments
For the first release, we focused on comparing two segments using geography and characteristics of the units, properties, and housing programs. Maps and historical trends were outside that scope.

This gave the experience a straightforward sequence: define two groups, then bring their unit counts, property counts, and rent statistics into one report. The layouts explored different ways to arrange that information, including horizontal and vertical tables.

I also used Claude Design to brainstorm layout directions as I worked through these possibilities.
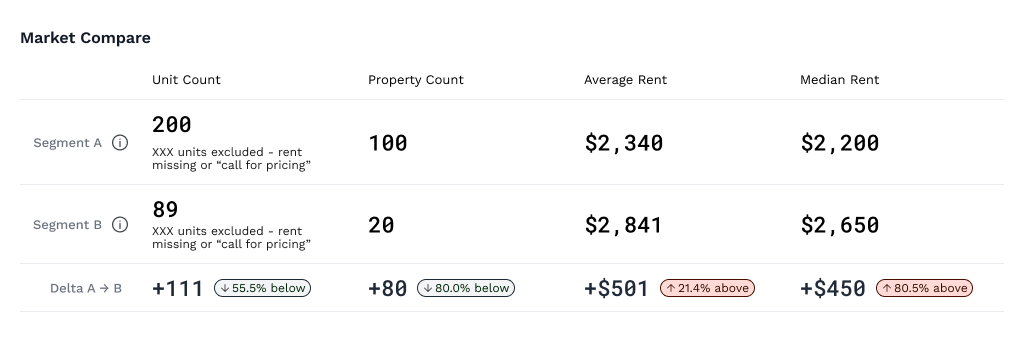
Early comparison table arranging Segment A, the difference, and Segment B in adjacent columns.

Side-by-side table for comparing unit counts, property counts, and rents.
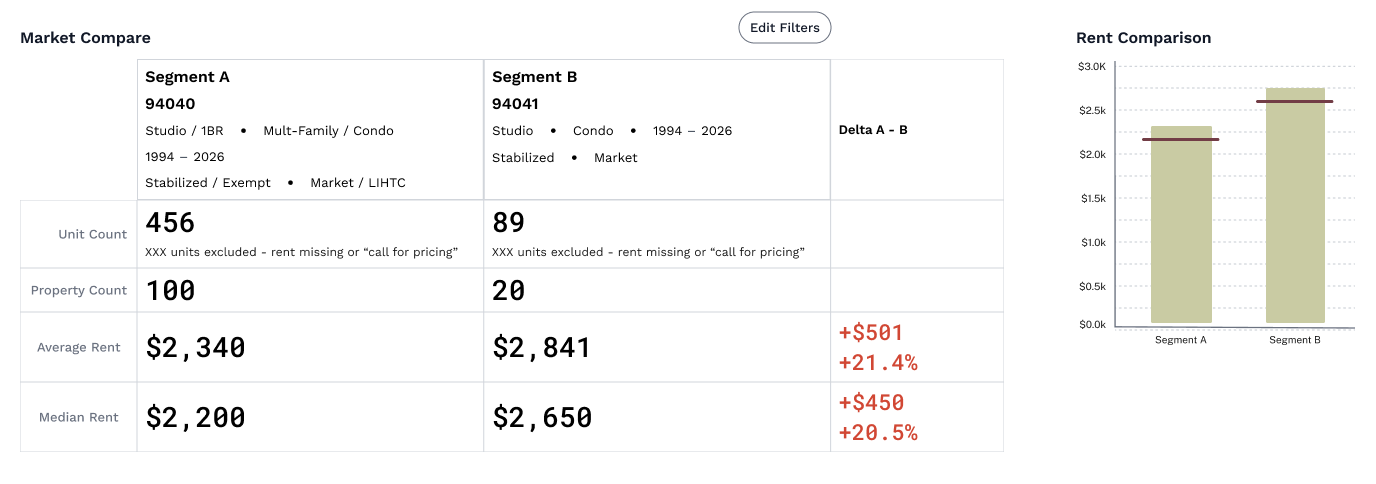
Segment summaries above rental metrics and a rent distribution chart.

Segment summaries keep the selected filters visible alongside rental metrics and a rent chart.
Making the Comparison Readable
Keep the segment definitions beside the results
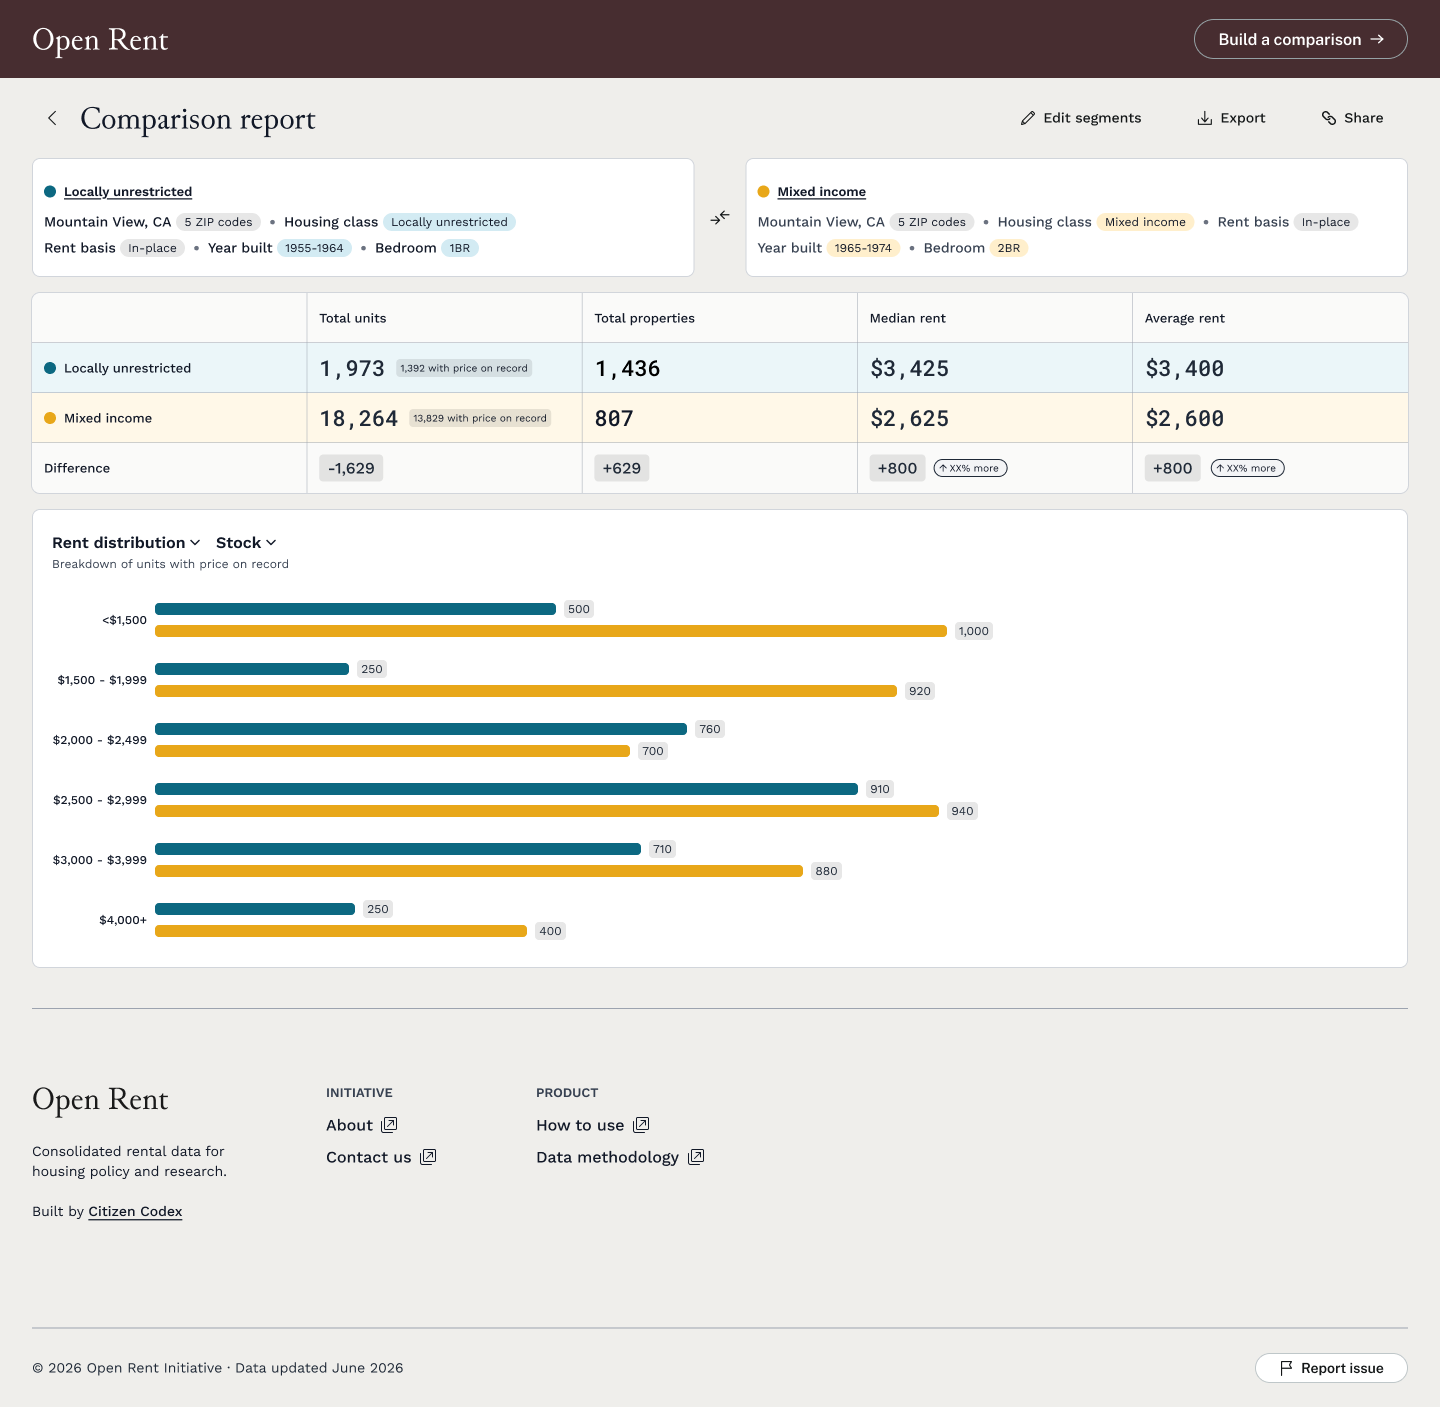
When staff see a difference in rent, they need to know which groups sit behind those numbers. I kept the filter summaries above the metrics table so they could check the setup as they read the results.

The interaction specification builds on this by leaving out filters set to “Any” and drawing attention to selections that differ between groups. Segment names reflect the selected housing class, and staff can rename them when a more specific label would help. Those names carry through to the report and charts.
Show the evidence behind a rent statistic
I wanted staff to be able to see how much information supported each rent figure. The design separates the total number of units in a group from the number with a recorded rent, making gaps in the data visible alongside the average or median.

The requirements also call for clear sources and exclusions. For an empty group, the planned behavior is to show “0 units match” and a dash for rent. Showing $0 would suggest a price the data doesn’t support.
Support a closer look beyond the headline number
An average or median gives staff a starting point. The rent-distribution chart lets them look further and see how recorded rents are spread across price bands. Names and numeric labels accompany color so people can follow each group in both the table and chart.

Breakdowns by building type, year built, and bedroom count also help explain what makes up each group. That context gives staff more to work with when interpreting a price difference.
Preserving a Comparison
Retain the setup before saved profiles are available
Mountain View staff wanted to come back to their comparisons without choosing all the filters again. Saved searches were already on the roadmap, but profiles and login weren’t available yet.

In the meantime, the URL kept the comparison settings. Staff could save the link for themselves or share it with a colleague and reopen the same setup. It gave them a way to pick up where they left off while account-based saving remained planned for a later release.
Outcome
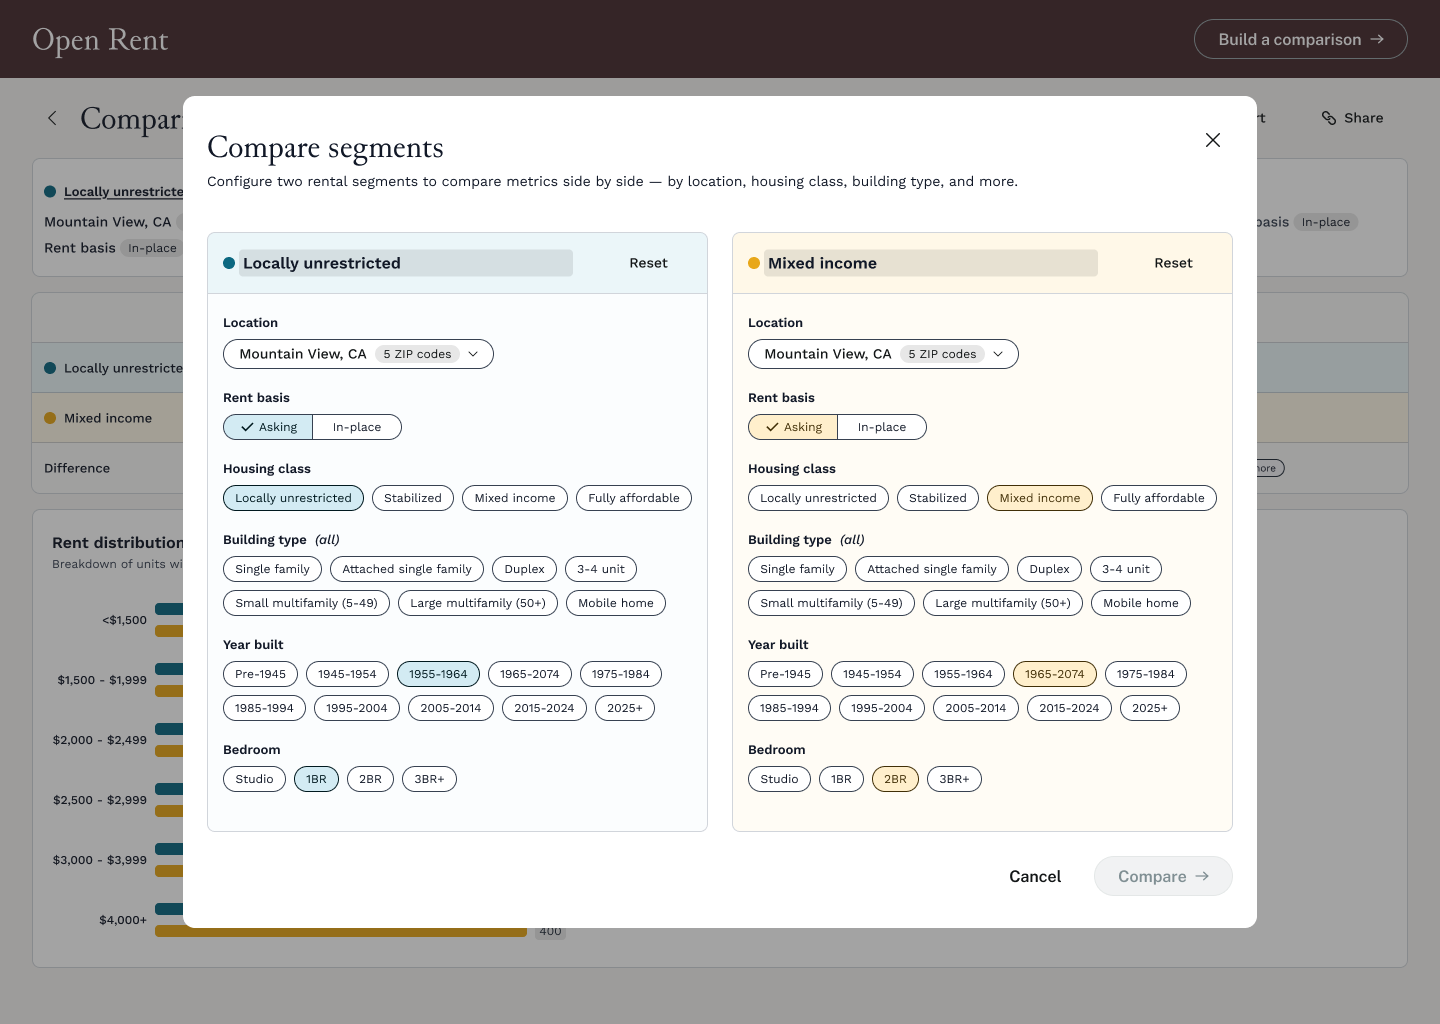
Two-panel segment configuration modal with location, rent basis, housing class, building type, year built, and bedroom filters.

The two segments use the same filter structure, allowing staff to configure and inspect them side by side.

A comparison workflow inside Open Rent
Compare Segments gives staff a place to build a comparison and work through what it means. They can define two groups, check their settings alongside the results, and see how much recorded data supports the rent figures.

The QA build supports the core experience: setting up two segments, viewing the report, revising the comparison, and keeping the settings in the URL. The live product has since grown to include more groups and a map.

The Figma screens shown here reflect my design work; current product screens show how the experience has developed. Adoption and time savings haven’t yet been measured in the evidence available for this case study.
What this project sharpened
This project made me pay closer attention to what people need around a number to understand it. A difference in rent can mean very different things depending on the filters, rent basis, and number of recorded prices behind it. I came away more deliberate about keeping that context close to the result, where people can use it.